
We are constantly looking for opportunities to improve the day trading alerts we send, so our subscribers can make more profit. We keep accumulating all kinds of information about each trading opportunity identified. In this article, we’d like to share some results of our research based on statistics of last six months.
Our system identifies about twenty trading opportunities daily. However, in average, it sends just 2-3 trading alerts per day. The system analyses a number of market parameters, selects the opportunities with maximum probability of success, and sends instant unbiased trading alerts to all subscribers. Some of the parameters the system is tracking are: difference with the Simple Moving Average (SMA) and growth potential. Growth potential shows how the stock price grew since the demand zone was formed. Usually, we do not consider opportunities with growth potential below 0.5%. The table below shows a summary of hypothetic trading results over six months between March and August 2016. It demonstrates how number of winning and losing trades depends on the initial parameters of the trade – potential growth and difference with SMA (50 intervals). In this experiment, the gain target was +0.4% and stop loss -0.6%.
| SMA Diff | Growth | 0.5-1 | 1-1.2 | 1.2-1.5 | 1.5-1.8 | 1.8-2 | 2-2.3 | 2.3-2.6 | 2.6 – 3 | >3 | Total |
| <-3 | # of trades | ||||||||||
| wins | |||||||||||
| losses | |||||||||||
| not sold | |||||||||||
| -3 – -2.5 | # of trades | 1 | 1 | ||||||||
| wins | |||||||||||
| losses | 1 | 1 | |||||||||
| not sold | |||||||||||
| -2.5 – -2 | # of trades | ||||||||||
| wins | |||||||||||
| losses | |||||||||||
| not sold | |||||||||||
| -2 – -1.6 | # of trades | ||||||||||
| wins | |||||||||||
| losses | |||||||||||
| not sold | |||||||||||
| -1.6 – -1.3 | # of trades | 1 | 1 | ||||||||
| wins | 1 | 1 | |||||||||
| losses | |||||||||||
| not sold | |||||||||||
| -1.3 – -1 | # of trades | 3 | 2 | 1 | 1 | 7 | |||||
| wins | 3 | 1 | 1 | 5 | |||||||
| losses | 1 | 1 | 2 | ||||||||
| not sold | |||||||||||
| -1 – -0.5 | # of trades | 25 | 2 | 3 | 1 | 1 | 32 | ||||
| wins | 7 | 1 | 1 | 1 | 10 | ||||||
| losses | 18 | 2 | 2 | 22 | |||||||
| not sold | |||||||||||
| -0.5 – -0.2 | # of trades | 54 | 6 | 1 | 61 | ||||||
| wins | 29 | 4 | 1 | 34 | |||||||
| losses | 24 | 2 | 26 | ||||||||
| not sold | 1 | 1 | |||||||||
| -0.2 – 0.1 | # of trades | 165 | 21 | 6 | 3 | 1 | 1 | 2 | 1 | 200 | |
| wins | 75 | 9 | 3 | 1 | 1 | 1 | 90 | ||||
| losses | 77 | 11 | 3 | 2 | 1 | 1 | 1 | 96 | |||
| not sold | 13 | 1 | 14 | ||||||||
| 0.1 – 0.5 | # of trades | 906 | 115 | 54 | 18 | 10 | 4 | 1 | 1 | 1 | 1,110 |
| wins | 485 | 54 | 31 | 8 | 3 | 2 | 1 | 1 | 1 | 586 | |
| losses | 330 | 56 | 21 | 8 | 7 | 2 | 424 | ||||
| not sold | 91 | 5 | 2 | 2 | 100 | ||||||
| 0.5 – 0.7 | # of trades | 62 | 50 | 38 | 13 | 3 | 3 | 3 | 2 | 1 | 175 |
| wins | 33 | 31 | 28 | 10 | 1 | 2 | 3 | 1 | 109 | ||
| losses | 27 | 18 | 9 | 3 | 1 | 1 | 1 | 1 | 61 | ||
| not sold | 2 | 1 | 1 | 1 | 5 | ||||||
| 0.7 – 1 | # of trades | 22 | 10 | 22 | 19 | 8 | 10 | 4 | 2 | 2 | 99 |
| wins | 17 | 8 | 12 | 13 | 5 | 8 | 2 | 2 | 2 | 69 | |
| losses | 5 | 2 | 10 | 6 | 3 | 2 | 2 | 30 | |||
| not sold | |||||||||||
| 1 – 1.2 | # of trades | 9 | 1 | 2 | 3 | 4 | 2 | 21 | |||
| wins | 3 | 2 | 1 | 3 | 1 | 10 | |||||
| losses | 6 | 1 | 2 | 1 | 1 | 11 | |||||
| not sold | |||||||||||
| 1.2 – 1.4 | # of trades | 3 | 2 | 1 | 1 | 1 | 1 | 5 | 4 | 18 | |
| wins | 2 | 1 | 1 | 3 | 2 | 9 | |||||
| losses | 1 | 2 | 1 | 1 | 2 | 2 | 9 | ||||
| not sold | |||||||||||
| 1.4 – 1.6 | # of trades | 2 | 1 | 3 | 2 | 8 | |||||
| wins | 1 | 1 | 3 | 1 | 6 | ||||||
| losses | 1 | 1 | 2 | ||||||||
| not sold | |||||||||||
| 1.6 – 1.8 | # of trades | 1 | 1 | 2 | 4 | ||||||
| wins | 1 | 1 | 2 | ||||||||
| losses | 2 | 2 | |||||||||
| not sold | |||||||||||
| 1.8 – 2 | # of trades | 2 | 3 | 5 | |||||||
| wins | 2 | 2 | 4 | ||||||||
| losses | 1 | 1 | |||||||||
| not sold | |||||||||||
| 2 – 2.3 | # of trades | 2 | 1 | 2 | 5 | ||||||
| wins | 1 | 1 | 2 | 4 | |||||||
| losses | 1 | 1 | |||||||||
| not sold | |||||||||||
| 2.3 – 2.6 | # of trades | 2 | 1 | 3 | |||||||
| wins | 1 | 1 | |||||||||
| losses | 2 | 2 | |||||||||
| not sold | |||||||||||
| >2.6 | # of trades | 1 | 4 | 5 | |||||||
| wins | 1 | 4 | 5 | ||||||||
| losses | |||||||||||
| not sold | |||||||||||
| Total | # of trades | 1,253 | 210 | 124 | 61 | 26 | 27 | 14 | 18 | 22 | 1,755 |
| wins | 656 | 107 | 76 | 37 | 11 | 19 | 10 | 14 | 15 | 945 | |
| losses | 490 | 96 | 45 | 22 | 14 | 8 | 4 | 4 | 7 | 690 | |
| not sold | 107 | 7 | 3 | 2 | 1 | 120 |
The system sends only the alerts from the highlighted area. Now, let’s consider returns generated on each interval. The statistics will look like this:
| 0.55-1 | 1-1.2 | 1.2-1.5 | 1.5-1.8 | 1.8-2 | 2-2.3 | 2.3-2.6 | 2.6 – 3 | >3 | Total | |
| <-3 | 0.0 | 0.0 | 0.0 | 0.0 | 0.0 | 0.0 | 0.0 | 0.0 | 0.0 | 0.0 |
| -3 – -2.5 | 0.0 | -0.6 | 0.0 | 0.0 | 0.0 | 0.0 | 0.0 | 0.0 | 0.0 | -0.6 |
| -2.5 – -2 | 0.0 | 0.0 | 0.0 | 0.0 | 0.0 | 0.0 | 0.0 | 0.0 | 0.0 | 0.0 |
| -2 – -1.6 | 0.0 | 0.0 | 0.0 | 0.0 | 0.0 | 0.0 | 0.0 | 0.0 | 0.0 | 0.0 |
| -1.6 – -1.3 | 0.4 | 0.0 | 0.0 | 0.0 | 0.0 | 0.0 | 0.0 | 0.0 | 0.0 | 0.4 |
| -1.3 – -1 | 1.2 | -0.2 | 0.0 | -0.6 | 0.0 | 0.0 | 0.4 | 0.0 | 0.0 | 0.8 |
| -1 – -0.5 | -8.0 | -1.2 | -0.8 | 0.4 | 0.0 | 0.4 | 0.0 | 0.0 | 0.0 | -9.2 |
| -0.5 – -0.2 | -2.8 | 0.4 | 0.0 | 0.0 | 0.0 | 0.4 | 0.0 | 0.0 | 0.0 | -2.0 |
| -0.2 – 0.1 | -16.2 | -3.0 | -0.6 | -0.8 | -0.6 | -0.6 | -0.2 | 0.4 | 0.0 | -21.6 |
| 0.1 – 0.5 | -4.0 | -12.0 | -0.2 | -1.6 | -3.0 | -0.4 | 0.4 | 0.4 | 0.4 | -20.0 |
| 0.5 – 0.7 | -3.0 | 1.6 | 5.8 | 2.2 | -0.2 | 0.2 | 1.2 | -0.2 | -0.6 | 7.0 |
| 0.7 – 1 | 3.8 | 2.0 | -1.2 | 1.6 | 0.2 | 2.0 | -0.4 | 0.8 | 0.8 | 9.6 |
| 1 – 1.2 | -2.4 | -0.6 | 0.0 | 0.8 | -0.8 | 0.6 | 0.0 | -0.2 | 0.0 | -2.6 |
| 1.2 – 1.4 | 0.2 | -1.2 | 0.0 | -0.6 | 0.4 | 0.4 | -0.6 | 0.0 | -0.4 | -1.8 |
| 1.4 – 1.6 | 0.0 | 0.0 | 0.0 | 0.0 | 0.0 | -0.2 | 0.4 | 1.2 | -0.2 | 1.2 |
| 1.6 – 1.8 | 0.0 | 0.0 | 0.4 | 0.4 | 0.0 | 0.0 | 0.0 | 0.0 | -1.2 | -0.4 |
| 1.8 – 2 | 0.0 | 0.0 | 0.0 | 0.0 | 0.0 | 0.0 | 0.0 | 0.8 | 0.2 | 1.0 |
| 2 – 2.3 | 0.0 | 0.0 | 0.0 | -0.2 | 0.0 | 0.0 | 0.4 | 0.0 | 0.8 | 1.0 |
| 2.3 – 2.6 | -1.2 | 0.0 | 0.0 | 0.0 | 0.0 | 0.0 | 0.0 | 0.0 | 0.4 | -0.8 |
| >2.6 | 0.4 | 0.0 | 0.0 | 0.0 | 0.0 | 0.0 | 0.0 | 0.0 | 1.6 | 2.0 |
Again, it’s growth in the columns and SMA(50) difference in rows.
Same data on the chart:

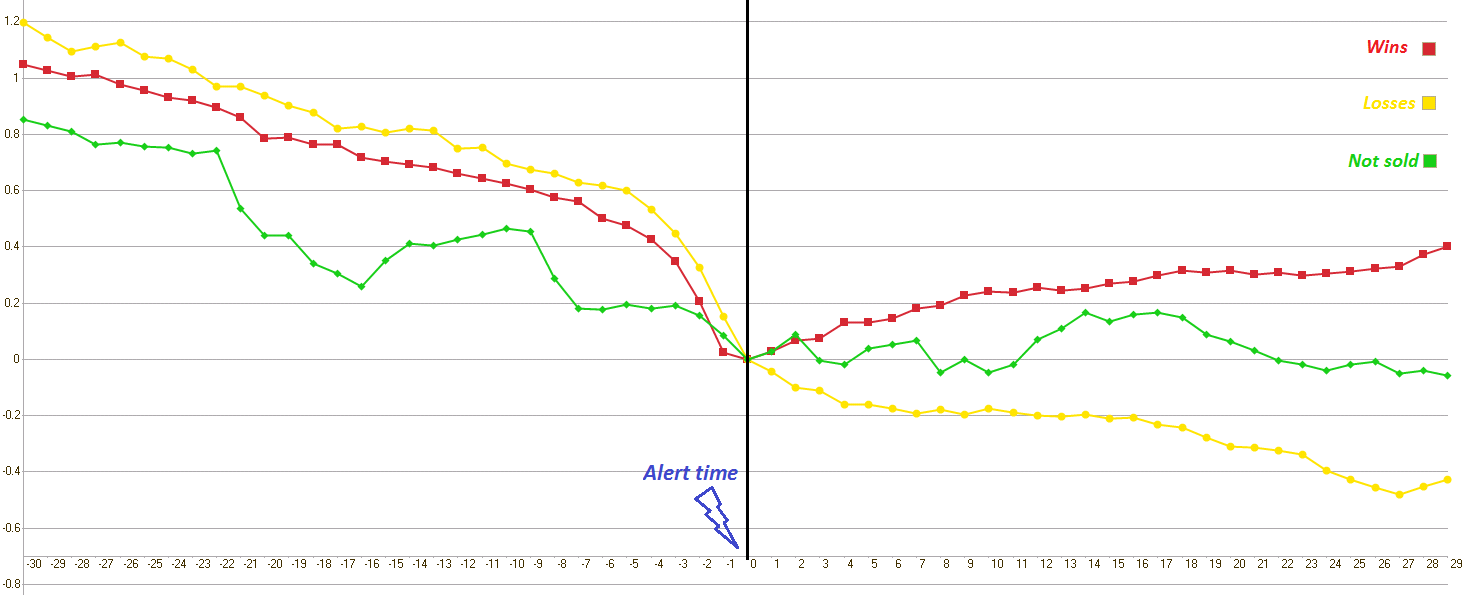
Here is another interesting chart. We analyzed about 300 instances of prices behavior 30 minutes before the alert and 30 minutes after. Red line shows the average price chart for winning trades, yellow – for losing trades, and green for the cases when the price moved sideways and haven’t achieved targets. As you can see, losing trades’ price curve has a sharper slope when approaching the alert time (coming back to the demand zone).
The statistics confirm that the day trading alerts generated by our system can help you to generate consistent positive returns. However, we don’t stop there and keep working on improving the quality of our alerts to make them even better. Besides the parameters mentioned (potential growth and difference with the SMA), we monitor many other characteristics such us: general market direction, volumes on different intervals, relations to day’s highs and lows, price behavior when the zone first appeared, bid and ask spread, and so on. We use all this data in our machine-learning algorithm, which will help us to make the day trading alerts even better.
If you haven’t subscribed to our trading alerts yet, please do so! It’s absolutely free! You will be able to unsubscribe any time if you want to.